Analyzing Website Traffic from Google Business Profile
Understanding how your Google Business Profile (GBP) drives website traffic is crucial for optimizing your online presence and maximizing your return on investment. Analyzing this data provides valuable insights into customer behavior and the effectiveness of your GBP strategy. By tracking website visits originating from your GBP, you can refine your online marketing efforts and improve overall business performance.Website traffic data is a key performance indicator (KPI) for evaluating Google Business Profile success.
It directly reflects the effectiveness of your GBP in attracting potential customers to your website, where they can explore your offerings, make purchases, or engage further with your brand. A high volume of website traffic from your GBP indicates a strong online presence and a successful strategy, while low traffic suggests areas for improvement.
Tracking Website Visits from Google Business Profile
Several methods exist for tracking website visits originating from your GBP. The most common and reliable approach involves utilizing Google Analytics. By linking your website to your Google Business Profile, you can track the “Source/Medium” of your website traffic. Specifically, look for traffic sources identified as “google” / “organic” or “google” / “(not set)”. While “google” / “(not set)” might not be perfectly precise, it generally signifies traffic from a Google source.
You can further refine your analysis by creating custom reports in Google Analytics to isolate traffic from your GBP. Alternatively, some website platforms offer built-in analytics that track referrals, providing similar insights into traffic sources.
Importance of Website Traffic Data in Evaluating Google Business Profile Performance
Analyzing website traffic from your GBP allows you to assess the effectiveness of your profile optimization strategies. For example, if you’ve recently updated your GBP photos or added a compelling call to action, you can measure the impact of these changes on website traffic. A significant increase suggests that your improvements are working. Conversely, stagnant or declining traffic might signal the need for adjustments to your GBP strategy or website content.
Essentially, this data provides quantifiable evidence of your GBP’s success in driving valuable customer interactions. Without tracking this data, you’re essentially operating your GBP in the dark.
Improving Website Traffic from Google Business Profile Listings
Optimizing your GBP to drive more website traffic involves several key strategies. Firstly, ensure your GBP is completely and accurately filled out, including all relevant business information, high-quality photos, and a clear call to action encouraging website visits (e.g., “Visit our website to learn more!”). Secondly, regularly update your GBP with fresh content and offers to keep it engaging and relevant.
Thirdly, consider utilizing Google Posts to promote special offers or events, driving traffic directly to your website. Finally, encourage customer reviews, as positive reviews boost your GBP’s visibility and attract more potential customers. A well-optimized GBP, combined with a user-friendly website, creates a seamless customer journey.
Visual Representation of Customer Journey
Imagine a flowchart. It begins with a customer searching for a product or service on Google. The customer sees your GBP listing at the top of the search results, complete with attractive photos and a clear call to action. An arrow points from the GBP listing to a clickable link directing the customer to your website. Another arrow then leads from your website to a conversion point, such as a purchase, inquiry, or form submission.
This visual representation illustrates the straightforward path a customer takes from your GBP listing to your website, demonstrating the direct impact of your GBP on your website traffic.
Interpreting Customer Interactions
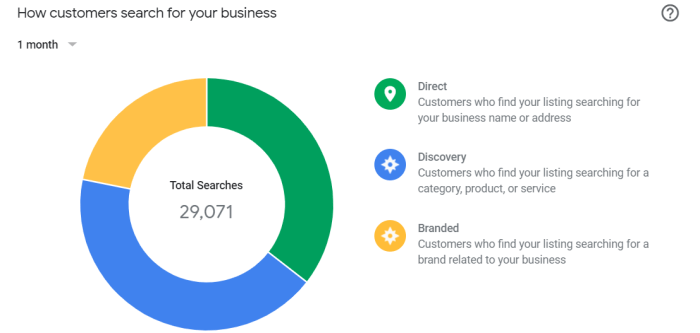
Understanding how customers interact with your Google Business Profile is crucial for optimizing your online presence and driving more business. Analyzing interaction data allows you to identify what’s working, what’s not, and where to focus your efforts for improved customer engagement and ultimately, increased revenue. This section will explore key metrics and strategies for interpreting this valuable data.Analyzing interaction data provides insights into customer behavior and helps refine your online strategy.
By examining different metrics, businesses can gain a clear picture of how effective their Google Business Profile is at attracting and engaging customers. This data-driven approach allows for informed decisions about improvements and resource allocation.
Key Metrics Related to Customer Interactions
The Google Business Profile provides a range of metrics to track customer interactions. Understanding these metrics is the first step in effective analysis. Key metrics include the number of phone calls received directly from your profile, the number of directions requested to your location, and the number of clicks leading to your website. Tracking these metrics over time provides valuable insights into trends and the effectiveness of your profile.
For example, a consistent increase in calls indicates strong profile visibility and clear call-to-action effectiveness. Conversely, a low number of website clicks might suggest a need to optimize your website link or improve its content relevance.
Comparing Call-to-Action Element Performance
Your Google Business Profile offers several call-to-action (CTA) elements, such as a phone number, website link, and directions button. Comparing the performance of these elements helps identify which are most effective at driving customer interactions. For instance, if website clicks significantly outperform calls, it suggests that potential customers prefer learning more about your business online before contacting you directly.
Conversely, a high number of calls might indicate a strong preference for immediate contact. This comparative analysis guides improvements to your profile’s CTA strategy, focusing resources on the most effective elements. A business might, for example, re-evaluate the prominence of its website link if calls consistently outnumber clicks.
Improving Customer Engagement Based on Interaction Data
Interaction data offers valuable opportunities to enhance customer engagement. Low call numbers could be addressed by ensuring your phone number is prominently displayed and easily accessible. Poor website click-through rates might be improved by crafting a compelling website link description that clearly communicates the value proposition of visiting your website. Similarly, a low number of direction requests might indicate a need to improve your profile’s location accuracy or add more prominent visual cues, like high-quality photos, to encourage visits.
Analyzing these trends allows for targeted improvements and more effective engagement. For example, a local bakery might add photos of its freshly baked goods to their profile to increase foot traffic.
Hierarchical Structure of Customer Interactions
Understanding the different types of customer interactions and their hierarchy helps prioritize improvement efforts. A logical structure could be:
- Direct Interactions: These are immediate actions taken by customers directly from your Google Business Profile.
- Phone Calls: Customers directly call your business from the listed phone number.
- Directions: Customers request directions to your business location.
- Indirect Interactions: These interactions involve a secondary step after the initial engagement with your Google Business Profile.
- Website Clicks: Customers click through to your website from your profile.
- Message Interactions (if enabled): Customers send messages through the messaging feature.
This hierarchical structure helps in prioritizing efforts towards improving high-impact interaction points. For example, focusing on improving the website experience following a website click is less effective than improving the prominence of the phone number if most interactions are through phone calls.
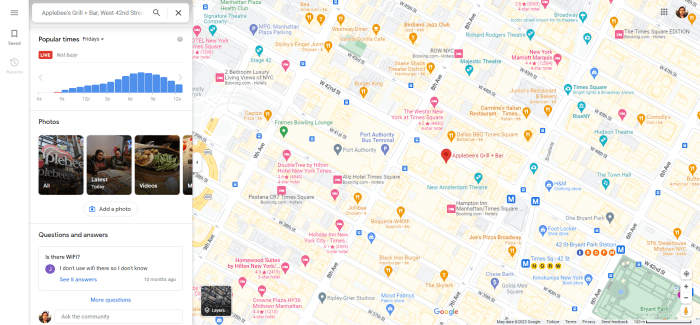
Photo and Post Performance
Understanding how your photos and posts perform on your Google Business Profile is crucial for optimizing your online presence and attracting more customers. Analyzing this data allows you to refine your content strategy, ensuring you’re showcasing your business in the most effective way. By tracking engagement metrics, you can identify what resonates with your audience and what doesn’t, leading to a higher return on your content creation efforts.Analyzing the performance of your photos and posts involves reviewing key metrics available within your Google Business Profile insights.
This includes metrics such as views, clicks, and engagement (likes, comments, shares). By regularly monitoring these metrics, you can gain valuable insights into what type of content performs best and adapt your strategy accordingly. A consistent approach to tracking and analyzing this data will yield significant improvements over time.
Analyzing Key Performance Indicators (KPIs)
The Google Business Profile dashboard provides a range of metrics to assess photo and post performance. Views indicate the number of times a photo or post was displayed. Clicks measure how many users interacted by clicking through to your website or another relevant link. Engagement metrics such as likes, comments, and shares reflect the level of interaction and interest generated by your content.
Comparing these metrics across different posts and photos reveals trends in what types of content are most effective. For example, high-engagement posts may indicate a successful approach to storytelling or highlight a particularly popular product or service. Low-engagement posts may suggest a need for content revisions or alternative approaches.
Best Practices for Creating Engaging Photos and Posts
Creating compelling visuals and concise, informative text is essential for maximizing engagement. High-quality images are crucial; they should be well-lit, sharp, and visually appealing. Professional photography is ideal, but even high-quality smartphone photos can be effective with good lighting and composition. Posts should be concise and engaging, utilizing strong calls to action. Consistency in posting frequency is also vital to maintaining visibility and keeping your audience engaged.
Consider using a content calendar to plan your posts in advance.
Content Types Resonating with Target Audiences
The types of content that resonate most effectively will vary depending on your target audience and industry. However, some general guidelines apply. High-quality product photography often performs well for retail businesses. Behind-the-scenes glimpses or employee spotlights can humanize a brand and increase engagement. User-generated content, such as customer reviews or photos, builds trust and social proof.
Time-sensitive offers and promotions often drive immediate engagement. Analyzing your own data will reveal which content resonates most effectively with your specific audience.
Effective Photo and Post Strategies by Industry Type
Understanding how different industries leverage photos and posts is key to crafting an effective strategy. Here are some examples:
- Restaurants: High-quality food photography, videos of cooking processes, customer testimonials with photos, daily specials announcements with appealing images.
- Retail: Product shots showcasing features and benefits, lifestyle images demonstrating product use, behind-the-scenes glimpses of the store or team, customer reviews with photos.
- Salons/Spas: Before-and-after photos of services, photos of the salon/spa environment, showcasing staff expertise, highlighting special offers and promotions.
- Healthcare: Professional photos of the clinic or staff, information graphics about services, patient testimonials (with consent), updates on new equipment or technologies.